Exporting metrics properly for Prometheus
Now to Prometheus which even if it comes late on this presentation is actually one of the first things I did setup on my application.
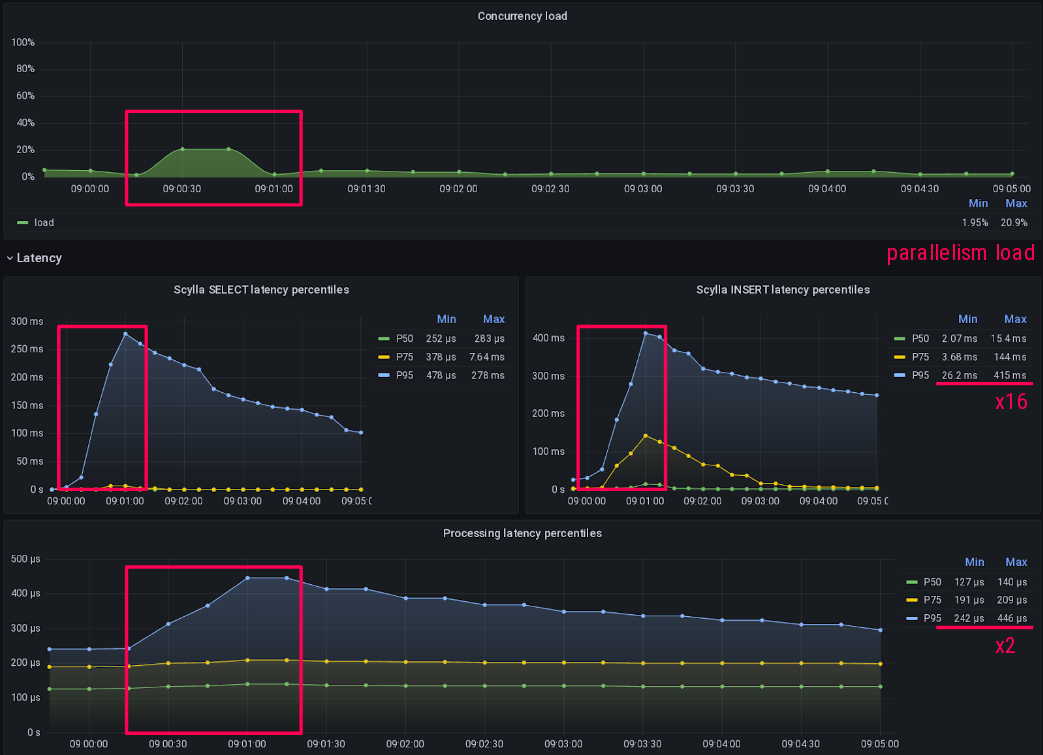
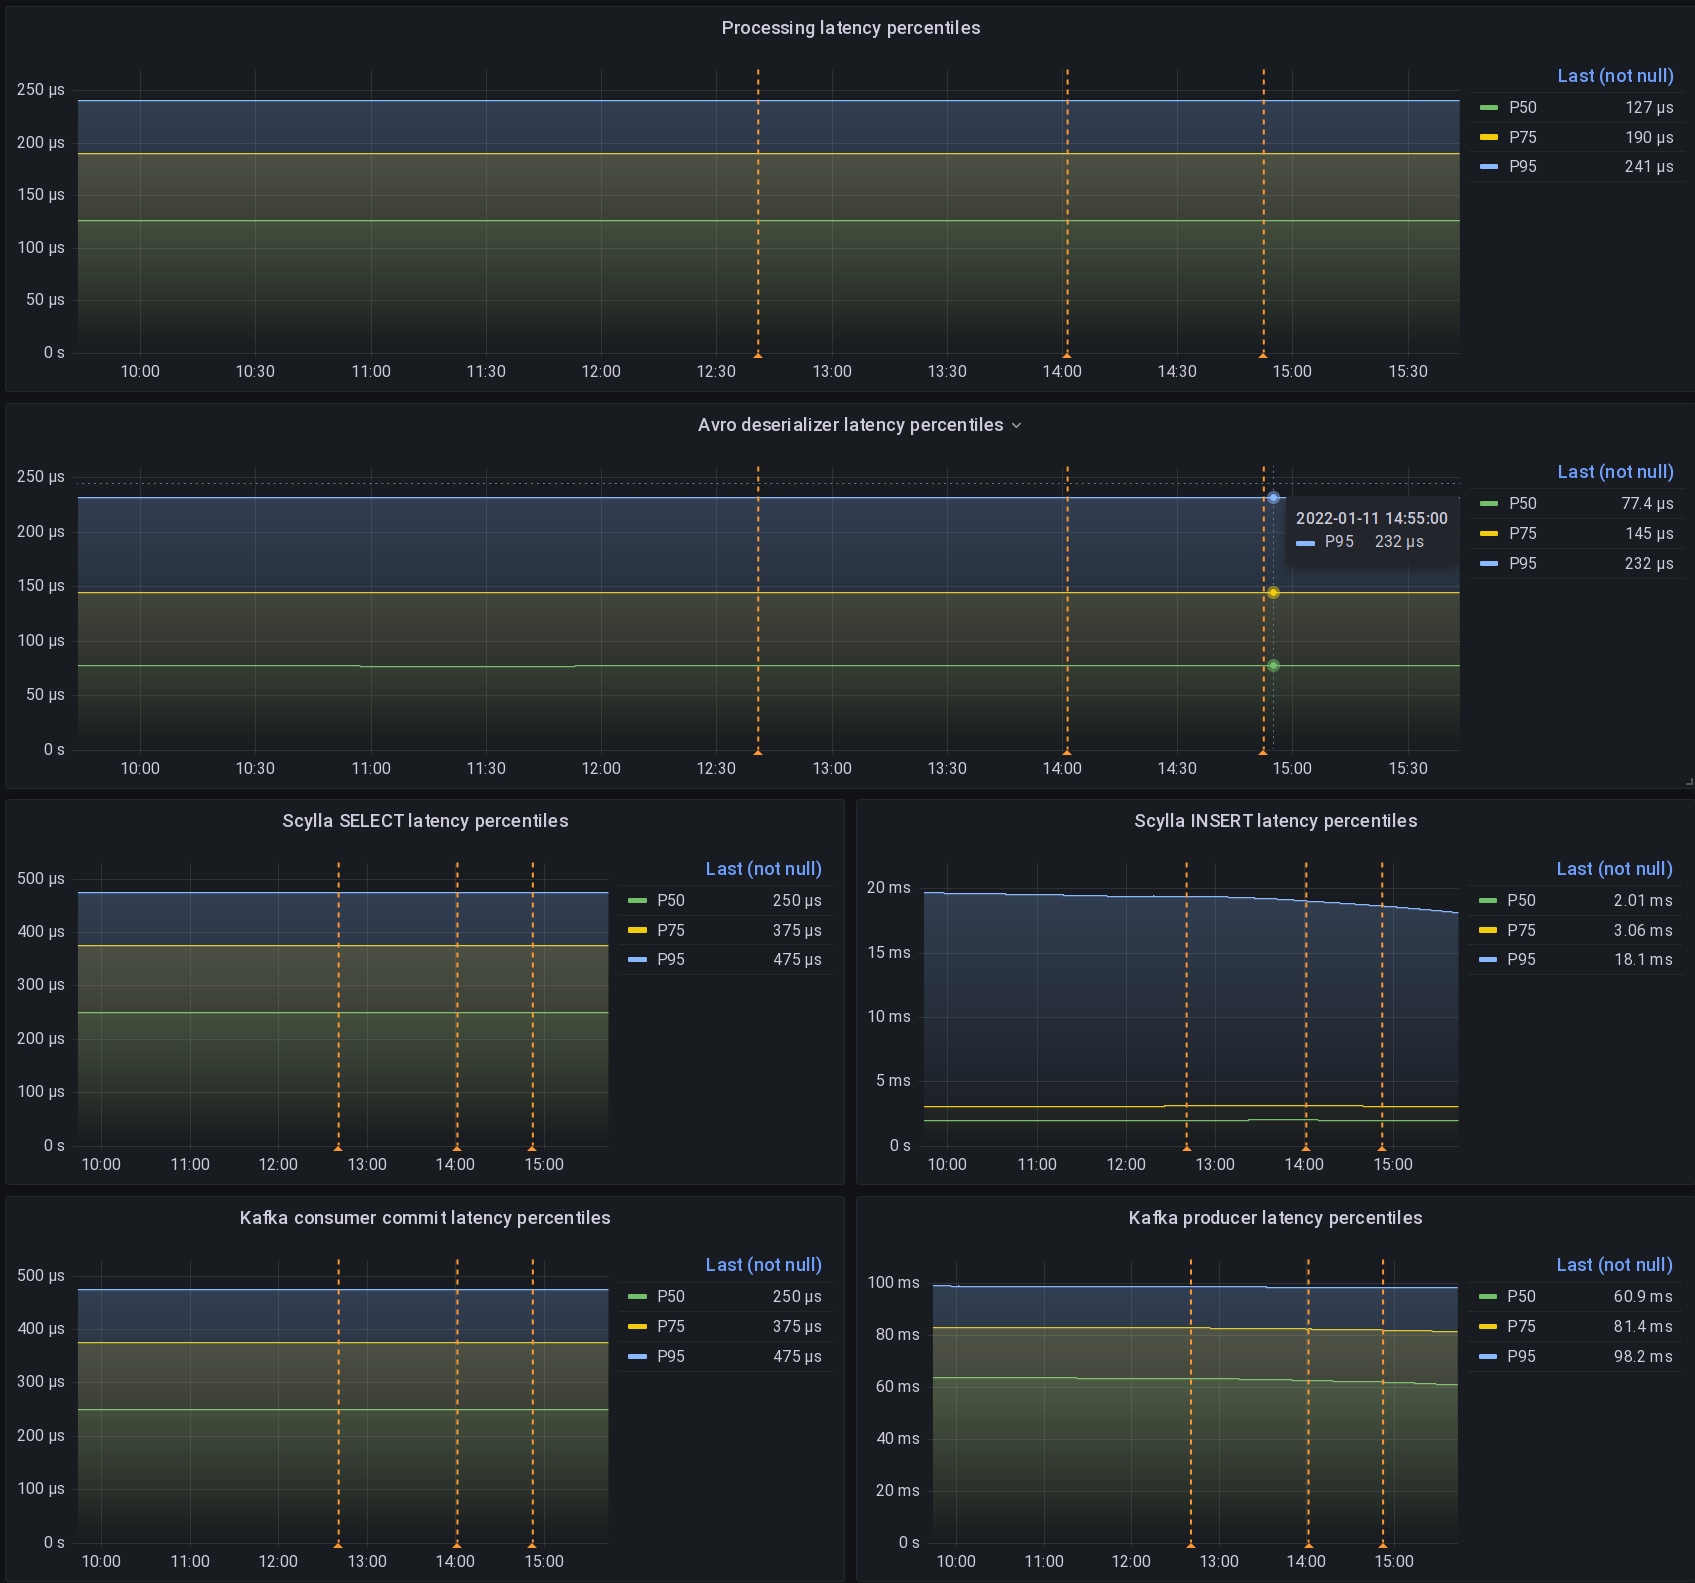
For all the experiments I did, I measured their latency and throughput impacts thanks to Prometheus.
For a test to be meaningful, those measurements must be made right and then graphed right. Scylla people know this by heart but it’s usually harder for mortals like the rest of us…
So here is an example of how I measure scylla query insertion latency.
The first and important gotcha is to setup your histogram bucket correctly with your expected graphing finesse:
pub static ref SCYLLA_INSERT_QUERIES_LATENCY_HIST_SEC: Histogram = register_histogram!(
          "scylla_insert_queries_latency_seconds",
          "Scylla INSERT query latency histogram in seconds",
          vec![0.0005, 0.001, 0.0025, 0.005, 0.01, 0.025, 0.05, 0.1, 0.25, 0.5, 1.0, 5.0, 15.0],
)
.expect("failed to create prometheus metric");
Here I expect scylla latency to vary between 50µs and 15s which is the maximal server timeout I’m allowing for writes.
Then I use it like this: I start a timer on the histogram and record its duration on success with timer.observe_duration(); and drop it on failure with drop(timer); so that my metrics are not polluted by possible errors.
let timer = SCYLLA_INSERT_QUERIES_LATENCY_HIST_SEC.start_timer();
match scylla_session
          .execute(scylla_statement, &scylla_parameters)
          .await
{
          Ok(_) => {
               timer.observe_duration();
               Ok(())
          }
          Err(err) => {
               drop(timer);
               PROCESSING_ERRORS_TOTAL
                    .with_label_values(&["scylla_insert"])
                    .inc();
               error!("insert_in_scylla: {:?}", err);
               Err(anyhow!(err))
          }
}

