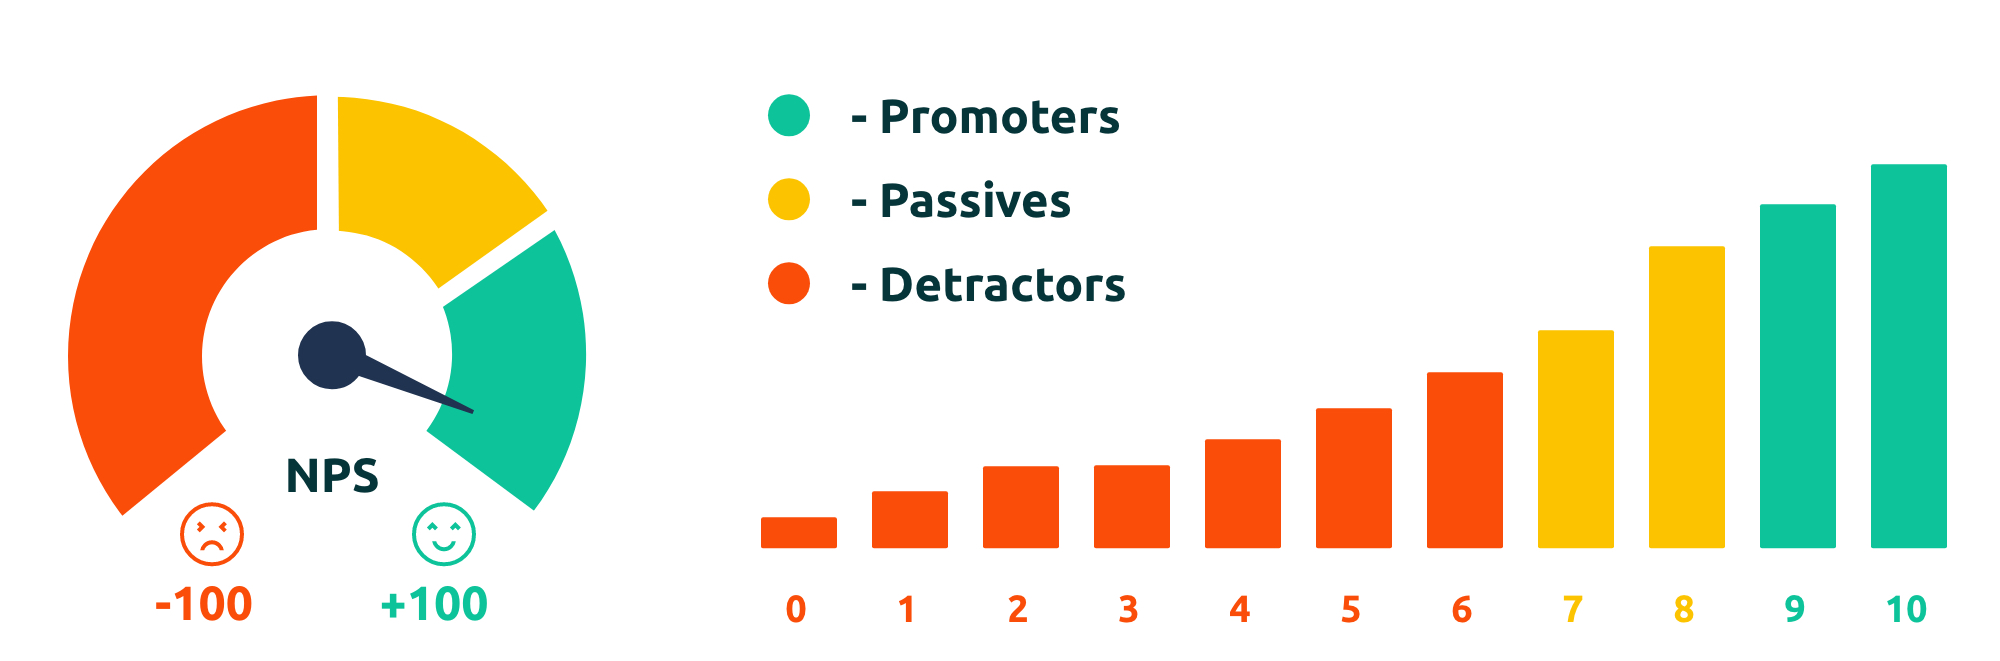
The American consultant Reichheld, considered a loyalty “guru”, spent two years devising a simple and effective measure of the satisfaction-loyalty link. His work, published in the Harvard Business Review in 2003, had a very important echo since it led to the design of a single question being, in the vast majority of cases studied, the ones that best predicted the effective loyalty behaviours of re-purchasing were, word-of-mouth and recommendations. This question, formulated as “Would you recommend [the brand] to a friend” appeared more appropriate in psychometric terms than a formulation directly addressing satisfaction, such as “Are you satisfied with […]”. The first characteristic of the NPS is therefore that it is based on a formulation that does not directly address the theme of customer satisfaction. The second innovation of the NPS is its scale. Based on a symmetrical Likert scale, the NPS is calculated with very restrictive criteria: only 9 and 10 are promoters. Scores less than or equal to 6 are considered as detractors. The calculation of the NPS is therefore done as follows: NPS = Promoters – Critics. The NPS is an index, not a percentage, it can be negative. The measure is widely used today, all sectors combined. For example, Tesla is frequently cited among the brands with a higher NPS, i.e. with a higher intention of recommendation.
Thus, the NPS leaves out neutral votes. It therefore allows us to focus on the clear-cut opinions of consumers. Therefore, it should not be used to compare entities or countries, which are sensitive to cultural bias. The analysis of the NPS should be done mainly as a relativity tool: in comparison with competitors, previous NPS already carried out, and with the specificities of the brand, product or service.
The Net Promoter Score